Newsletter June 2021
Using the Linde-Hampson process as an example, we demonstrate the simulation of hydrogen liquefaction with the TIL Add-on Hydrogen-Energy-Systems as well as the visualization of the results in DaVE.
The importance of hydrogen as an energy carrier keeps growing, especially for mobile applications. For efficient storage, hydrogen can be liquefied at a temperature of about 20 K. Such low temperatures can be reached using the Linde-Hampson process. The overall process can be modeled - at first in a simplified form - with standard TIL components (figure 1). Both steady-state and dynamic simulations can be performed. TLK also provides the TIL Add-On Library Hydrogen-Energy-Systems (in short "TIL H2"). It contains additional reservoirs and pressure tanks as well as hydrogen refueling systems. In the fall release, models for fuel cell systems with additional BoP components will be added, and TILMedia will contain substance data extensions for hydrogen liquefaction. In subsequent releases we will provide further models, for example electrolyzers. We will be happy to offer customer-tailored solutions in this respect.
In the following, we explain the individual steps of hydrogen liquefaction shown in figure 1.
Compressed-gaseous-Hydrogen supply (CGH2 supply)
First, gaseous (normal) hydrogen from standard gas cylinders is throttled with a pressure reducer to a chosen process high pressure. Hydrogen heats up during this throttling due to the (at this point still) negative Joule-Thomson coefficient.
Precooling
This is followed by roughly isobaric heat transfer in a countercurrent heat exchanger. The heat exchanger enables an energy exchange between the inflowing warm hydrogen and the outflowing cold hydrogen.
Precooling with liquid Nitrogen (LN2)
The already precooled hydrogen is now cooled down further with the aid of vaporized nitrogen in a subsequent countercurrent heat exchanger before it flows through a container with liquid nitrogen. The cooled gaseous hydrogen now has a temperature of approximately 77 K and is at about the pressure level set with the pressure reducer.
Linde-Hampson process
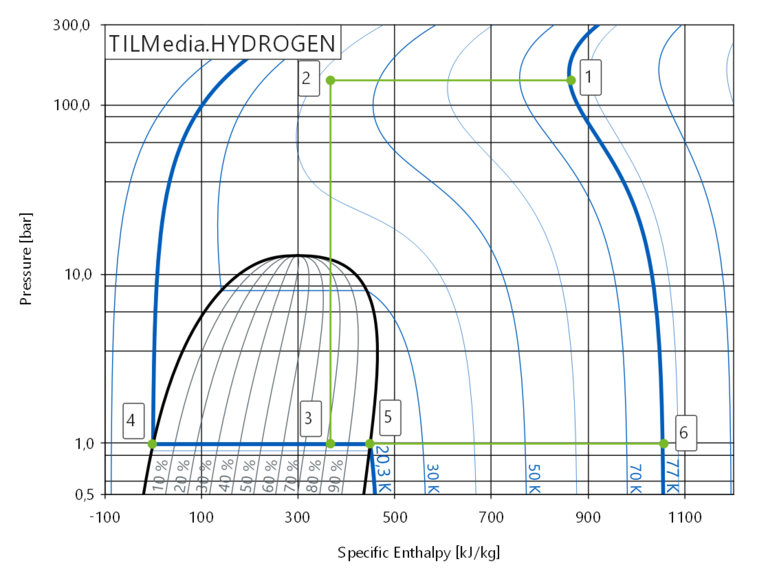
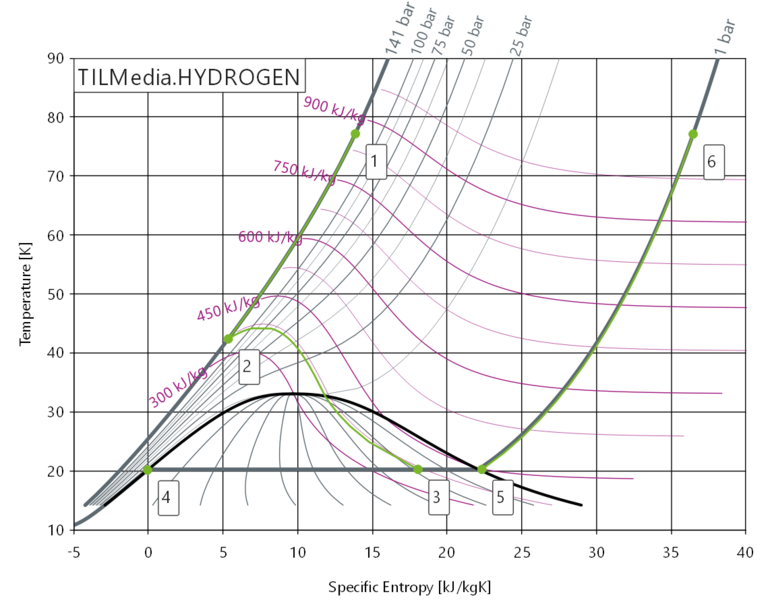
The hydrogen flows into a third countercurrent heat exchanger. Now the Linde-Hampson process begins. In the stationary case, the hydrogen is precooled with hydrogen vapor (state changes 1-2 and 5-6 in figures 1-3). This is followed by isenthalpic throttling, during which the hydrogen is expanded from the process high pressure into the two-phase region (2-3). During throttling, the hydrogen crosses its Joule-Thomson inversion line and thus initially warms up but then cools down altogether. While the vaporous portion of the hydrogen (state 5) is used to precool the hydrogen entering the countercurrent heat exchanger (state 1), the liquid portion (state 4) can be extracted. The returning gaseous hydrogen then passes through all of the above mentioned countercurrent heat exchangers to precool the CGH2 and is released near ambient pressure and temperature into the environment. Alternatively, it can be reintroduced into the process with a compressor.
Using the TIL model of a hydrogen liquefaction plant as presented here, a wide range of information can be obtained. In addition to the component and system design, the modeling also allows a detailed analysis of the influencing variables, e.g. the heat exchanger geometries, the pressure levels and the throughput on the efficiency of the process. Furthermore, suitable control concepts can be designed and tested with TIL.
The results can then be visualized and evaluated over time in DaVE. For this purpose, p-h- or T-s-diagrams, among others, are suitable. In figure 2 and figure 3, these diagrams are shown as an example for the stationary Linde-Hampson process with normal hydrogen after liquid nitrogen precooling. The labeled states can also be found in figure 1.
For further information on hydrogen please contact Dr. rer. nat. André Thüring
For further information on TIL please contact Dipl.-Ing. Ingo Frohböse
For further information on DaVE please contact Dipl.-Ing. Mario Schlickhoff
We would be happy to support you with your questions about hydrogen-based energy systems. We also welcome your suggestions and ideas.
With the new release 2.3 of our visualization and simulation environment DaVE, it is now possible to create Mollier-h-s diagrams, set time offsets of different data sources and integrate DaVE with LabVIEW even better.
DaVE 2.3 release
Soon we will provide you with the DaVE installer for version 2.3 for download. The current version 2.3 contains numerous innovations and improvements, of which only the most important are mentioned below.
Mollier-h-s diagram
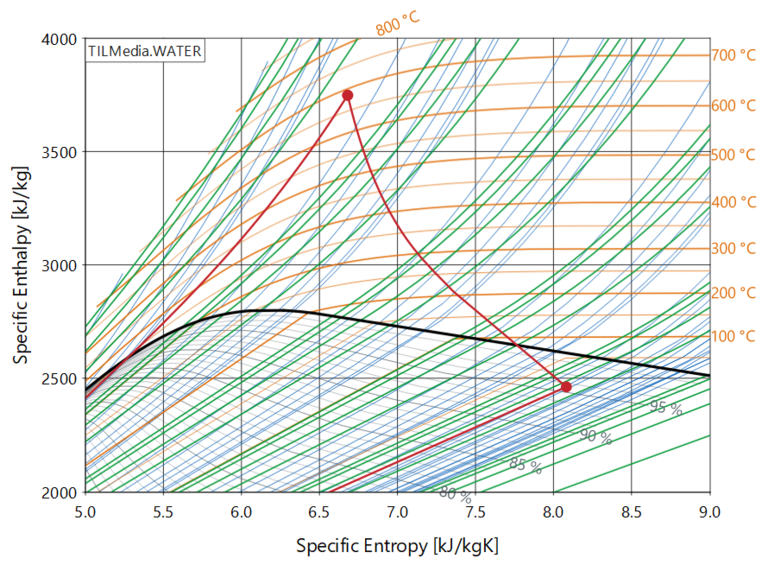
With the h-s diagram, you now have another state diagram at hand with which information on specific enthalpy and entropy as well as temperature, pressure and vapor fraction can be displayed. The Mollier-h-s diagram is used - in addition to the p-h diagram - for example in power plant or refrigeration technology.
Time settings
New options for data connectors and the DaVE timeline allow for a targeted selection of the data to be handled. By specifying an offset for the time data, individual data connectors can be shifted relatively to each other. This makes it easier to match simulation results with measurement data, for example. The global setting of permissible minimum and maximum times makes it possible to work with slices of long data sources.
New options for instruments
Various new features are available for the instruments in DaVE. For example, vector plots of TIL components can be created very easily via a new automatic feature. New options - such as the definition of decimal character to be used or the autoscaling of plot axes - allow changing the graphical display to fit the individual needs.
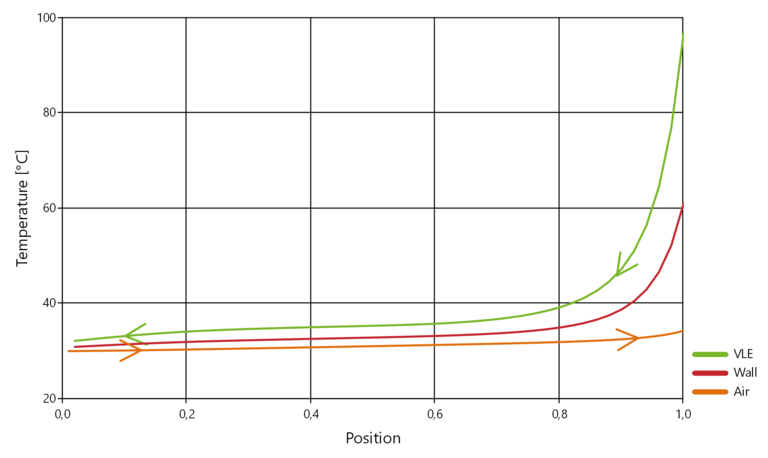
Figure 5: Exemplary temperature curves in a counterflow heat exchanger, plotted over the dimensionless length
DaVE-LabVIEW-Interface
The new version of the interface between DaVE and LabVIEW simplifies the data transfer from LabVIEW to DaVE. Any visualizations such as state diagrams, line diagrams and RI schematics with current states can be continuously adapted during measurement operation without changing the LabVIEW measurement program. During the development of the interface, special attention was paid to simple integration into existing LabVIEW programs. Experiences from our in-house measuring operation have also been incorporated in this process.
Thank you for your valuable feedback. With your suggestions, you have contributed significantly to the further development of DaVE. The DaVE team is always looking forward to a continued good cooperation. Please feel free to contact us.
For further information please contact Dipl.-Ing. Mario Schlickhoff
The new version 2.2 of MoBA Automation simplifies the development of extensive workflows. Thanks to standardized ready-to-use workflows, you can reach your goal even faster.
The new draft mode for continuous workflow development
Our MoBA Automation enables the automation of individual workflows for model- or measurement data-based development, analysis and optimization of technical systems. Version 2.2 is available for download since the end of April.
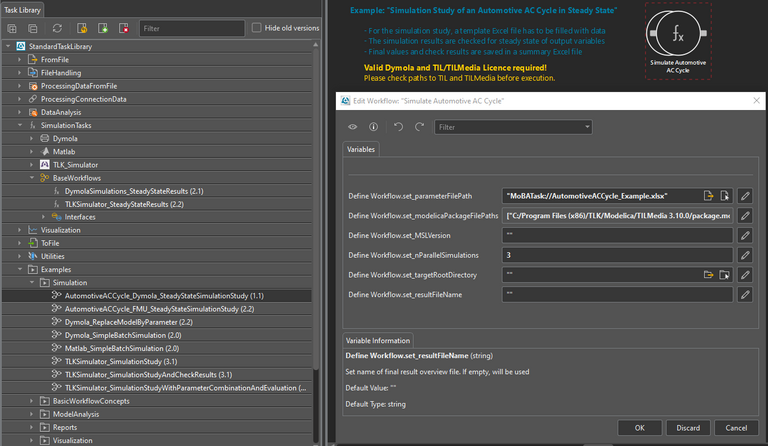
The new draft mode makes it possible to build and test a workflow step by step without having to re-run successful tasks. This shortens development time, since the results of longer simulation tasks do not have to be created again, for example. Draft mode can be activated in the toolbar of the configuration view for the respective workflow. If the tasks are successful (green status ring), they can be frozen via the Freeze command in the context menu (gray filling). New tasks can now be added to the workflow and executed.
New concept of ready-to-use workflows for e.g. steady-state simulations
With predefined input tables, ready-to-use workflows simplify implementations for typical task classes. These include, for example, steady-state simulations in Dymola or for FMUs, file comparisons for regression tests as well as measurement data matching and control analysis.
Figure 7: The simple configuration of the ready-to-use workflow allows existing workflows to be flexibly adapted to new projects
Ready-to-use workflows can be combined with each other using standardized inputs and outputs. For instance, the outputs of the workflow of a steady-state simulation study can be used as input of the workflows for control analysis or for measurement data validation with only one task connection. The steady-state simulation workflows for Dymola models and FMUs allow to address the different problems within a simulation study with only one workflow. Only the file path to the completed table template, the model file paths and the number of parallel simulation instances need to be specified for parameterization. The workflow offers:
Other customized solutions
In addition to the standard tasks, we offer our customers further customized solutions that can be used for special automation jobs. Please contact us, if we can support you in the realization of your workflows.
The list of all new features of release 2.2 can be found in the release notes.
We would like to thank you for your valuable feedback, which has contributed significantly to the further development of MoBA. Of course, we continue to work on improving the ergonomics of our MoBA Automation with great pleasure and enthusiasm.
If you have any suggestions and for further information, please contact:
Determination of Refrigerant Leakage
Measurements and Test Benches for Specification-Compliant Annual Leakage Rates
With the help of our new SHED chamber test stand, we can now also support you in determining specification-compliant annual leakage rates.
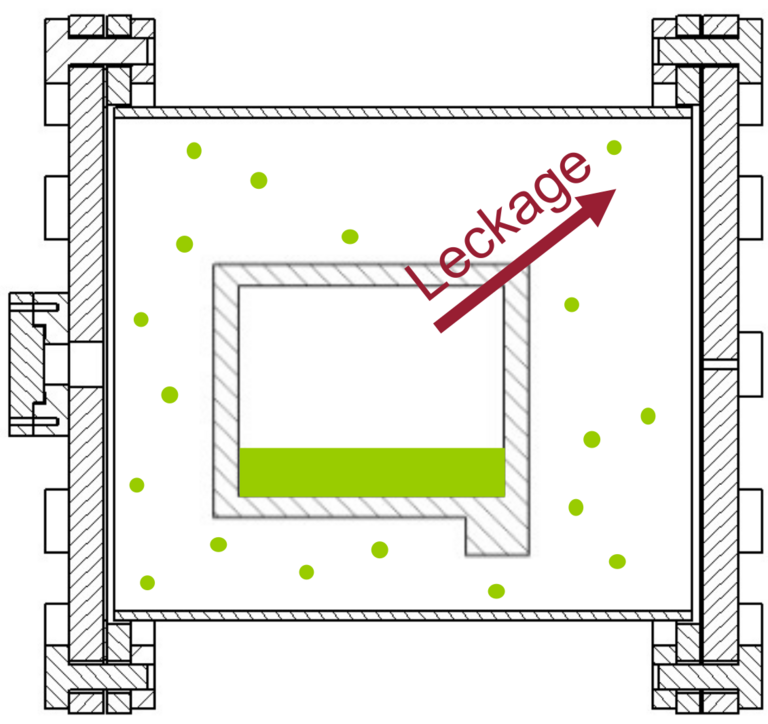
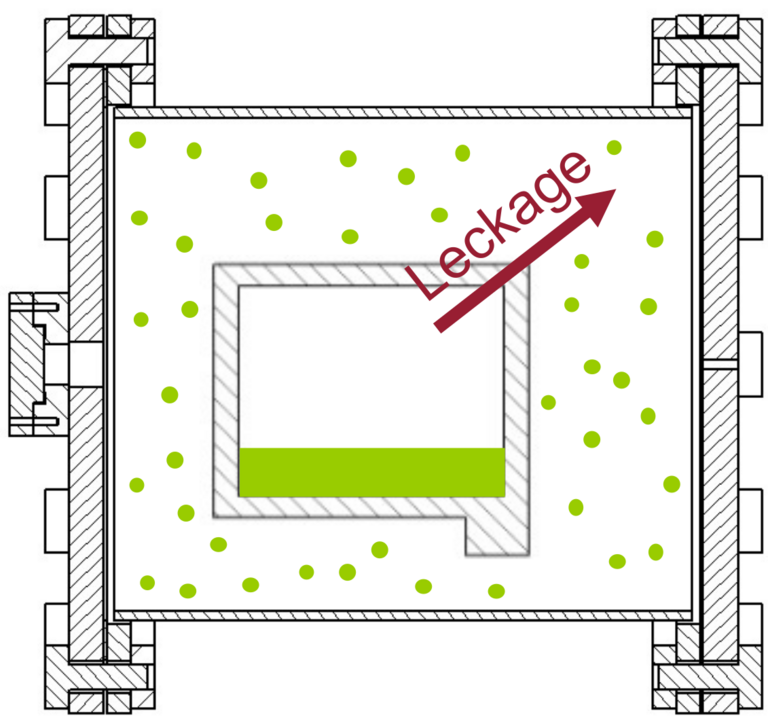
Components of refrigerant and heat pump circuits should - with regard to environmental sustainability and maintenance intervals - allow for the lowest possible release of refrigerant into the atmosphere. The system manufacturer's specifications therefore define the maximum tolerable leakage rates. With our new SHED chamber test rig, we can measure the refrigerant leakage of various components for ambient conditions from -30°C to 80°C and different specified charge levels. To do this, we first determine the increase in refrigerant concentration in the chamber volume surrounding the component over time. On this basis, we calculate a value for predicting the expected annual leakage.
Figure 8: Refrigerant compressor in SHED chamber with demonstrated leakage and increase in concentration at different times
The system is designed for measuring components. In the future, it will also be possible to measure the leakage rate of entire systems. Please feel free to contact us.
In addition, we offer a wide range of other measurements. Recent additions are the examination possibilities of the following components and complete systems:
If desired, we supplement the measurements performed with comprehensive and thermodynamically founded processing of the measurement data using our in-house software tools.
It is a special concern of ours to implement the wishes of our customers quickly and flexibly. According to your ideas, we realize new test stands in our test laboratory, with which we investigate your questions and collect the measurement data you require. Please contact us.
For further information please contact:
Expanding our Competence on Oil in Refrigerant Circuits
Innovative Measurement Methods and Model Libraries to Improve System Efficiency
TLK is continuing its R&D activities on the subject of oil in refrigerant circuits. After completion of the research project KÖVER, we start another research project in this field with ERNI.
About three billion refrigeration, air-conditioning and heat pump systems are operated worldwide that contain oil to lubricate the refrigerant compressor. The energy efficiency, performance and system behavior of these systems are strongly influenced by the refrigerant charge, which itself depends significantly on the amount of lubricant oil. In the recently completed KÖVER project, TLK researched refrigerant oil distribution in refrigeration circuits together with Technische Universität Braunschweig. Methods for measuring oil distribution were successfully developed and used in first follow-up projects.
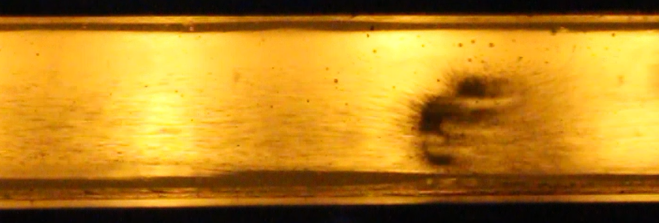
Within the framework of KÖVER, new measurement methods for balancing the refrigerant-oil distribution were developed inter alia. For example, the developed method for gravimetric determination of the mass distribution of refrigerant and oil in the system shows good reproducibility and high quality of the measurement results.
Figure 9: Oil flow with strongly inhomogeneous R744 concentration, resulting in streaks and even areas with gaseous R744 (dark area)
Furthermore, new calculation models were created in KÖVER. Among other things, we implemented new methods for calculating mixture behavior in the TILMedia library. An extensive interface to the external fluid property data library Multiflash was also created here.
Using real-time computational methods, we can now determine oil circulation rates (OCR) based on models using sensor signals.
Regarding the effects of oil filling levels on cooling, air-conditioning and heat pump systems, further questions arose in the process of KÖVER, which TLK and TU Braunschweig will examine more closely in the research project ERNI (Erfassung der Nichtgleichgewichtszustände von Kältemittel-Öl-Gemischen zur energetischen Optimierung und Emissionsreduktion von Kompakt-Kaltdampfsystemen = detection of non-equilibrium states of refrigerant-oil mixtures for energetic optimization and emission reduction of compact vapor compression systems). The objective of the new project is the research and development of an innovative model library, which enables the dynamic simulation of compact refrigeration systems under consideration of the non-equilibrium states of the refrigerant-oil mixture. Furthermore, a simulation-based oil filling quantity reduction method is to be made available. Finally, the prototypical model library will be tested on different heat pump systems.
For further questions on the KÖVER and ERNI projects and on the subject of oil in refrigerant circuits, please contact:
Together with our partner TLK-Energy, we will be offering online and on-site training courses for Modelica and TIL starting in September 2021. You can find the dates here.

